
Week 10
This past week has dealt all with numbers and graphics—how can they mislead us? What is their import? Why should we be careful of the numbers and statistics we encounter, as well as the graphs we see? Moreover, why might someone want to mislead us?
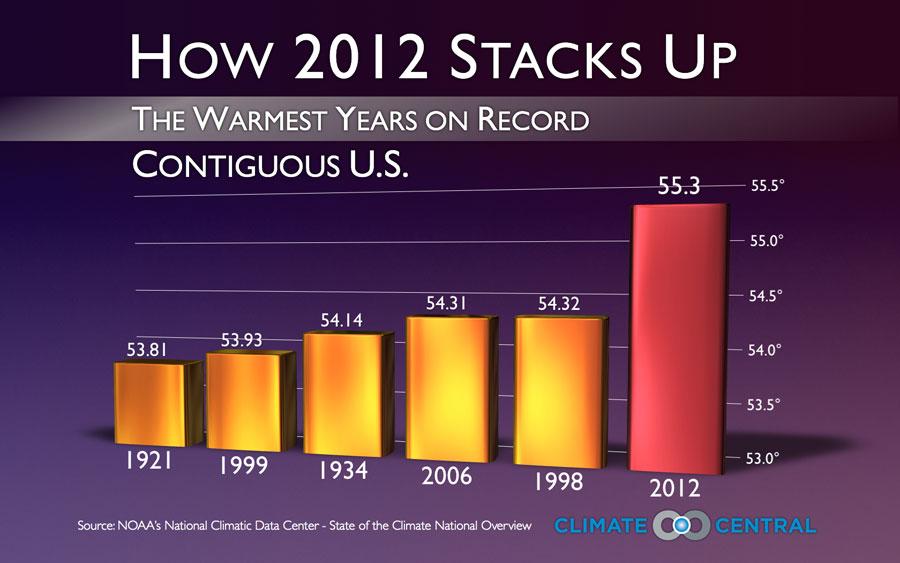
Source: http://themonkeycage.org/wp-content/uploads/2013/01/1-8-13-CC-2012-warmest-bargraph-CONUS.jpg
 But let’s take it back a step. What kind of literacy are we talking about here?
Data literacy—how do you read the numbers? How do the numbers correlate with the sources, or do they?
Causation and Correlation are two different beasts
- So, how do you begin to disseminate the real statistics from the “fake news”?
Remembering that causation and correlation are two different matters. Studies and the people who interpret them tend to perceive correlation as causation: i.e., if you drink too much alcohol, your risk for cancer may increase. (This is a real study: http://time.com/5015058/alcohol-cancer-risk/) However, people will read this as cause and effect, rather than there being a link between the two.
Having a background in data literacy/statistical literacy. A few people brought this up—how can librarians be expected to help wade through the information waves (“It’s possible to drown in an inch of information, let alone a sea.”)? Schools often do not teach such courses and this class was the first to mention it, at least in this program. However, it can be vital to helping patrons and students understand what’s really going on.
Sense Making versus Opinion Making
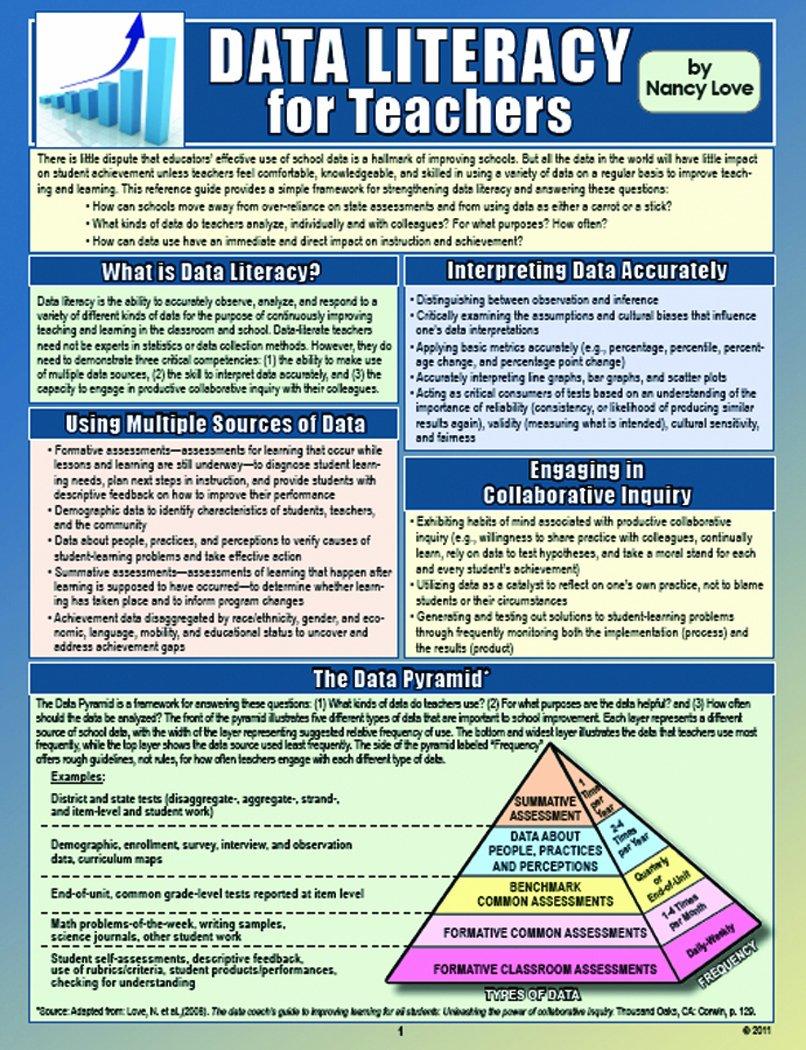
- Another facet of data literacy is “sense making” versus “opinion making”. http://datalit.sites.uofmhosting.net/wp-content/uploads/2016/04/Abilock-and-Williams.pdf An infographic here demonstrates what students need to know to create infographics—it’s not just about what’s aesthetically pleasing. It also involves having multiple sources and ways to gain information.
A few students mentioned the Voices of Literacy video and how “data is interdisciplinary”. Numbers don’t exist in a bubble. As much as it might unsettle people, we need to be able to locate where the numbers came from, make students skeptical about the numbers they encounter, and figure out how numbers link from one discipline to another.
How Much Ground is There to Really Cover?
- One must consider how large the subject area really is. Gina Policastro said “I really liked Fontichario and Oehrli's article, "Why Data Literacy Matters," because they address the issue of the enormity of data literacy as a topic; the best way to address it: "One bite at a time" (22).”
Numbers can seem overwhelming at first and therefore, need to be regarded with both an open mind and a critical eye. For example, as Elizabeth Norris mentioned, even colors can be used with an aim to confuse and obfuscate the issue. We also tend to get overwhelmed by the statistics, graphs, and charts, and overlook them or ignore them outright. This harkens back to my point about librarians needing some background in data literacy, to better serve their population.
Personal Investments
- Another interesting point brought up is the idea, as mentioned by Erin Plummer, that we need to invest students personally in why data matters and why we need to look critically at it. Students are told why they should care about the environment, but not why they should care about numbers and statistics, nor why they are so important.
Data as a Weapon or a Manipulation
- How can data be used against you? This is something, again, that people don’t think about all that often. Fitbit, which was mentioned as an example, could be used against you. The FBI and the police are involved with Apple in trying to gain access to criminal’s iPhones to check for incriminating data. (https://www.cnbc.com/2016/03/29/apple-vs-fbi-all-you-need-to-know.html)
Moreover, data can be used to, as Mary-Catherine Jenkins said, “Make you feel good.” The census, she noted, has a way of skewing the numbers so certain parties are underrepresented or information they consider undesirable has been removed. For example, EPA removed information that it considered unsavory from its website. In an era where “truthiness” is more than just a Colbert word, but a truism, we must be careful where we step, and we must back up our data accordingly.
I chose a rather simple format. Like I mentioned before, it’s easy to become overwhelmed with data. I was likewise overwhelmed by all the responses from our classmates. I thought it best to keep it simple, providing only a few concrete examples that our classmates can peruse.
No comments:
Post a Comment